
Over this past weekend we were able to join Nerds for Nature at the Bioblitz at Lake Merritt in Oakland CA. While there we ran the first of a series of experiments using HUGO to land at predefined way points in the lake to receive and log sensor data from an array attached to the outside of the aircraft. For the proof of concept flights this weekend we recorded temperature and pH readings that were stored on a sD card located inside the shell. Check out our article in Scientific American

Sensor array mounted to the front of a specially outfitted HUGO capable of water landings.
Here you can see the sensor array we have designed for water quality testing. At the front of the array is a temperature probe and behind that will be housed different sensors including pH, salinity, and dissolved oxygen. Moving forward we hope to be able to develop and refine the data we are collecting as well as begin to create accurate maps and ongoing "monitoring stations" based on GPS coordinates.
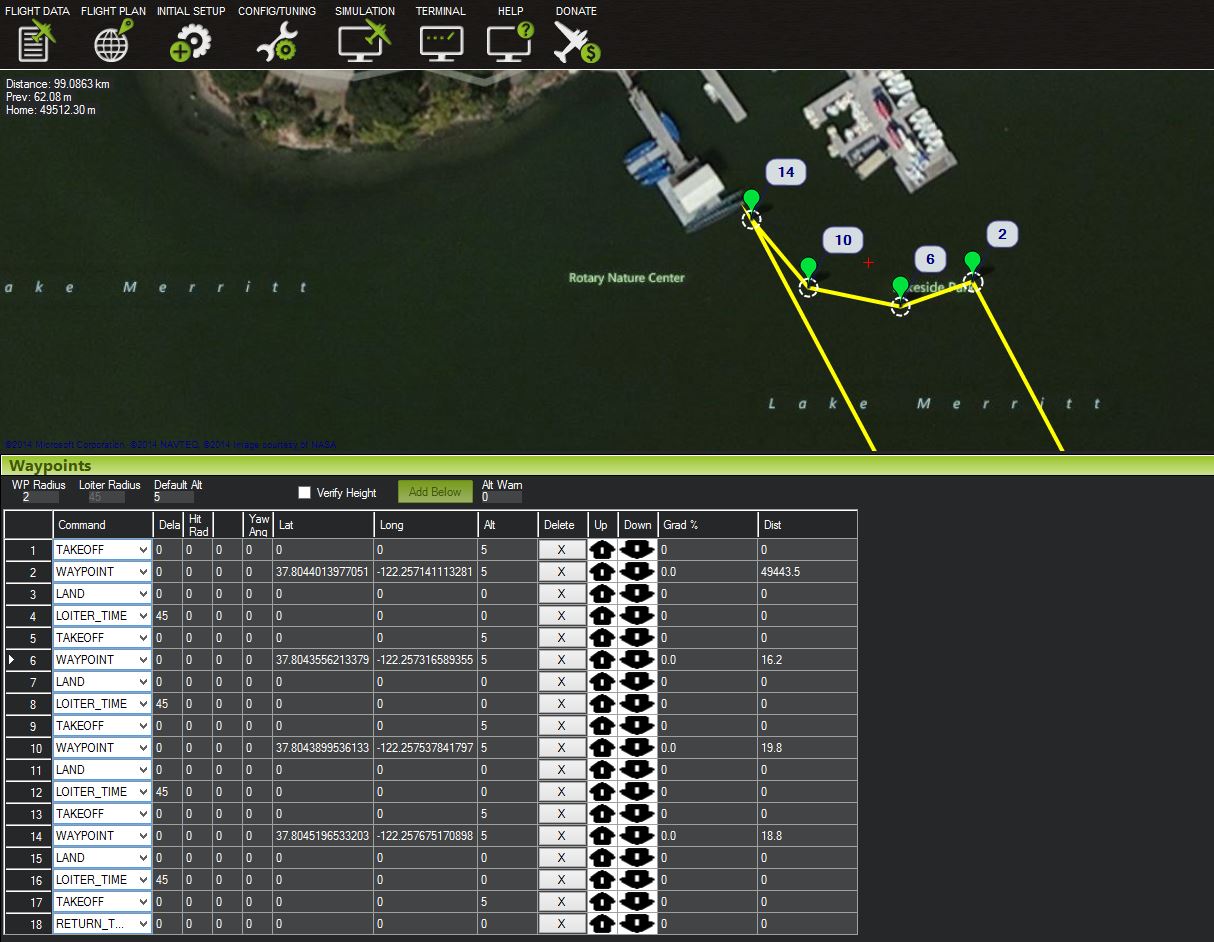
Screen shot of Mission Plan
Here you can see the mission plan created to indicate the sampling locations. Using this method it is possible to have virtual monitoring stations accurate to within a couple meters each time sample readings are taken. These would probably be at inlets and outlets of a body of water and possibly at the location of on shore sources of pollution/runoff.

HUGO navigating to a GPS way-point or "monitoring station"
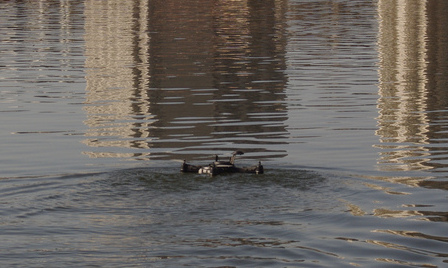
Landing to receive sensor readings.
The first tests were quite successful with the flight plan executing as expected and all sensor data being recorded as planned. One note visible on the readings in the graph below indicate the temperature probe had yet to normalize before moving to the next location. We will make adjustments to the "delay" used to solve for this.

Graph of Temp, pH/time